Hello, Everyone. We’re back in the saddle following the MoSCoW Prioritization piece. While we’re on the subject of prioritization, let’s have a look at how we’ll investigate the RICE prioritization process.
As you may recall, in our last post, we used Spotify features and issues to complete the MoSCoW prioritizing process. In this post, we’ll spice things up by going through a series of RICE prioritization exercises using hypothetical Netflix features.
Let’s get started, shall we?
What is RICE Prioritization?
The RICE scoring model is a prioritizing system developed to assist product managers in determining which products, features, and other efforts to prioritize by evaluating these things based on four criteria. The acronym is made up of the four components mentioned before that we use to assess product ideas:
- Reach
- Impact
- Confidence
- Effort
With a RICE scoring technique, you take your suggested features or initiatives, rank them according to their Reach, Impact, Confidence, and Effort, and then take a step back and utilize the ratings you’ve generated to select which features make the cut.

Reach
The first aspect in calculating your RICE score is estimating how many people your product will reach in a particular period. You must define what “reach” means in this context as well as the duration over which you wish to assess it. You may choose any period—a month, a quarter, etc.—and pick whether reach refers to the number of client transactions, free-trial signups, or how many current users test your new product. The number you estimated will be your reach score.
Impact
The impact can indicate a quantifiable aim, such as how many new conversions your product will generate when consumers come across it, or a more qualitative one, such as boosting customer happiness. In each product, value is seen differently. It is difficult to quantify the impact exactly. So we choose from a multiple-choice scale:
- 3 for “huge effect,”
- 2 for “high,”
- 1 for “medium,”
- 0.5 for “low,”
- 0.25 for “minimum.”
These values are multiplied together to get the final score, which may be scaled up or down. Choosing an impact number may seem to be irrational. But keep in mind that the alternative is a tangled jumble of gut feelings.
Confidence
A confidence score serves as a bias brake, compensating for overly optimistic impact scores. If you believe an initiative will have a large impact but lack the data to back it up, confidence allows you to control that.
Confidence is expressed as a percentage, and another multiple-choice scale is used to aid minimize decision paralysis:
- 100 percent equals “great confidence,”
- 80 percent equals “medium confidence,”
- 50 percent equals “poor confidence.”
If you get a confidence level of less than 50%, consider it a “moonshot” and think your efforts should be elsewhere.
Effort
So far, all of the elements in the RICE equation are a sum of the potential advantages an idea will have toward a given aim. It’s now time to consider the mitigating factor: the Effort score. This is where you calculate how much time your coworkers will need to devote to a project. The units are calculated as the amount of work that one team member can complete in a month. As a result, the units are either “person-months” or “person-weeks.”
Understand that a RICE score isn’t some sort of mathematical wizardry that can transform hazy, unsubstantiated concepts into money signs. A RICE score is only one activity you may do to arrange the order in which you should approach ideas depending on how costly they are to tackle in comparison to the influence each concept has on a goal.
Let’s get started on the prioritizing process, shall we?
Step 1 – Laying out the Features and Issues
For the purpose of this post, let us set out those 7 hypothetical Netflix features and concerns and begin the ranking process –
| 1. Custom playlists and an Improved “My List” |
| 2. Partnership with IMDB or Rotten Tomatoes |
| 3. Push notification or reminder device for when films are expiring |
| 4. Easy access to international content |
| 5. Offering free trials for new users |
| 6. Live streaming for gaming enthusiasts. |
Step 2 – Understanding the business
As you may be aware, Netflix’s followed a strategy known as the DHM model (Delight Customers in Hard to Copy, Margin-enhancing ways)to drive product strategy. It simply implies that you want to assist your firm in making more money so that you may invest in developing an even better product in the future. Product executives must strike a balance between satisfying consumers and positively impacting profits. Personalization, streaming, original content, and sound/video quality were the only techniques that applied to all three, and they all contributed to Netflix’s huge success. Let’s take a look at four crucial strategies, each of which can please consumers in unique, margin-boosting ways:
| 1. Personalization – This feature makes it simple for users to select and watch movies they’ll like, and it’s also difficult to replicate. Personalization boosts Netflix’s margins by allowing the company to “right-size” its content expenditure based on projections of how many subscribers will watch a movie or TV show. |
| 2. Original Content – Customers are delighted with Netflix’s unique programming. And the corporation continues to benefit from its difficult-to-copy economies of scale, spending roughly twice as much on content as its closest competitor. |
| 3. A better viewing experience – Netflix invests in solutions that improve a member’s viewing experience. Examples include Ultra HD video/sound, bespoke playback speed, and a plethora of difficult-to-copy technology that “simply works” regardless of a member’s device or bandwidth. |
| 4. Interactive Stories – Netflix is developing tools for studios to create interactive storylines as well as allowing users to “select their experience.” It’s worth noting that Netflix isn’t competing with other streaming providers. It’s competing for a piece of customers’ screen time and aims to win it. |
Now that we have seen its major strategy points, let’s understand the key priorities.
| Prioritizing expansion to generate economies of scale, a brand, and a broader network Netflix will seek methods to enhance its economic efficiency to reinvest the extra revenues in original content and continue to grow engagement as measured by monthly retention. |
The product strategy and priorities are detailed. It is now time to grasp the data that will be used to support the prioritizing.
Step 3 – The House of Stats
Let’s look at the statistics of Netflix and let them help us decide our prioritization journey –
| 1. According to Q4 2021 figures, Netflix currently has over 222 million worldwide paying users, more than 75 million of them are in the United States and Canada, with the United States leading the pack. |
| 2. Netflix’s customized recommendation system has the potential to be worth $1 billion per year. Around 80% of Netflix subscribers follow the streaming service’s algorithm’s title suggestions. |
| 3. Netflix has material available in over 60 languages. |
| 4. Total net revenue is expected to be close to $29.7 billion each year in 2021, with operating profits of $5.1 billion (2021) |
| 5. Netflix shattered that record in 2021, with 129 nominations and winning a whopping 44 awards. This broke CBS’s record for most Emmy awards in a single year, which had stood since 1974. |
| 6. Netflix leads the charge with 36 Oscar nominations in 2021, ten of which are for the feature Mank. |
| 7. By 2020, Netflix customers were watching an average of 3.2 hours of video each day, totaling 6 billion hours per month. Since activating their Netflix account, users have watched over 1,130 hours of video, or 49 days. |
| 8. The United States now has the biggest Netflix content collection, with 5,800 titles as of October 2021. |
| 9. 5% of Netflix subscribers watch the service on television. |
Now let’s use these stats to begin our RICE scoring process.
Step 4 – The RICE Scoring
- Before we begin the exercise, it is critical that we understand how we assess the success of our product. I’d want to assess the performance of Netflix’s recommendation engine in the context of the Indian market. When I think of Netflix, I think of it as one of the leaders in the OTT industry, with more content to view in every genre and language. Because of the aforementioned characteristics, everyone today is aware of Netflix. Because of the increased competition, we must engage our consumers effectively and at a high rate to save our users. As a result, we must concentrate on Engagement. By engagement, I mean engagement related to watching/finding movies. We are at a point where cash flow is more important than anything else because only then can we increase our Banner to further new productions and get things under our umbrella. As a result of the above, I am certain that monetization and engagement should be our primary objectives.
- Now, let’s pick one part of Netflix, the recommendation algorithm, and create a user experience around it –
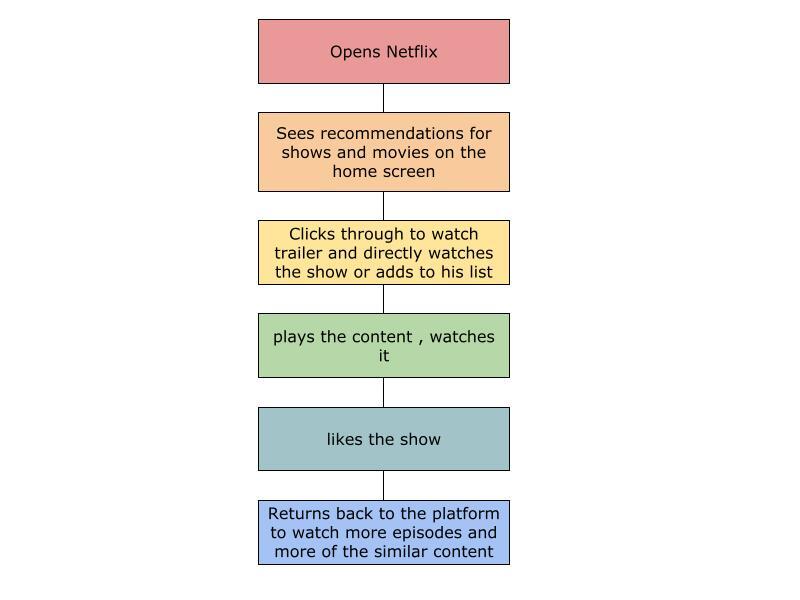
Many of the steps that a user takes to interact with the platform are heavily tied to the recommendation system, and with this insight, I would then look at metrics relating to these actions that assist us to get closer to our objective –
| 1. Home Screen CTR |
| 2. Trending Movies CTR |
| 3. CTR of various sections on the home screen can aid in the improvement of recommendations |
| 4. Number of new things added to my list per week as a result of recommendations |
| 5. Per week, the number of new trailers seen from the suggestions |
| 6. Per week, the percentage of people who see trailers convert to watching series or movies. |
| 7. The average number of minutes spent every week watching recommended series/movies |
| 8. Minutes of stuff watched per week from suggestions |
| 9. The average amount of time a user spends per day viewing Netflix |
| 10. Time spent on Netflix on average per session |
Now will all the information on hand, it’s time for some RICE scoring
Are you still wondering why?
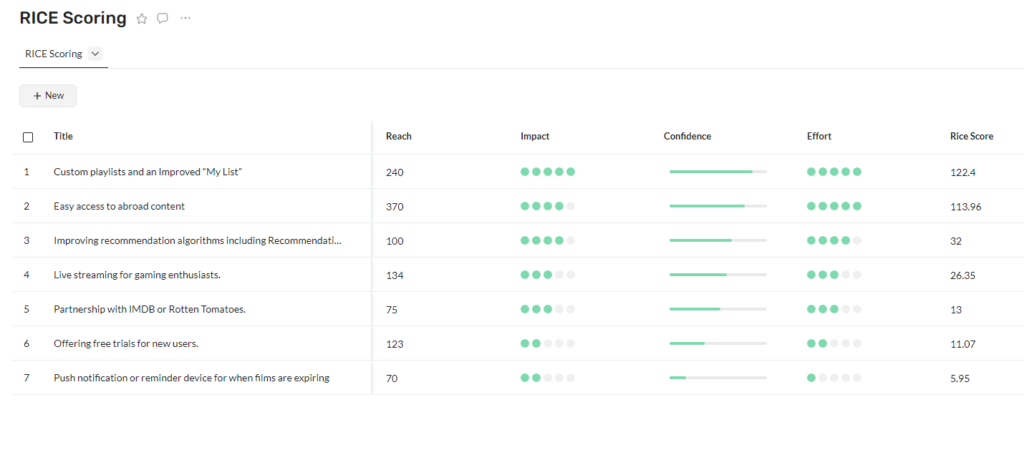
Let us take one of the features (A custom playlist and an Improved “My list”) as an example for reasoning here –
- According to the source, we have a total of 300 Million Netflix viewers, and 80% of those viewers follow their own personal recommendations engine.
- If we make improvements in the recommendation engine and allow them to create their own custom playlist, we will be able to reach 240 Million users and have 3 level impact with 84% Confidence and 5 Level of effort.
- So with the formulae stated above the RICE score will be 122.4
Conclusion
You will be able to select when to create exceptions if you have a clear priority framework and a scoring system.
RICE can be particularly useful for comparing difficult-to-compare ideas. It challenges you to consider why a product concept will be relevant and forces you to be realistic about the amount of effort required to attain the goal. Try RICE in your own prioritizing process and let us know how it goes.